Blog Post

Investment Market Review 2nd Qtr 2019

  • By Gary Clark
  • 22 Aug, 2019

From the financial crisis of 2008-2009 until the present:

 ·     Out of the ordinary investment market conditions

·     The level of risk we face in maintaining our standard of living during retirement

·     Related challenges in accomplishing our financial goals.

Approx. 40 Years of Tailwinds began

Resulting from:

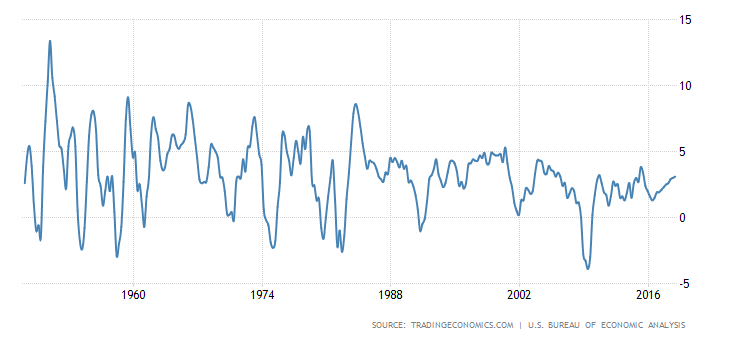
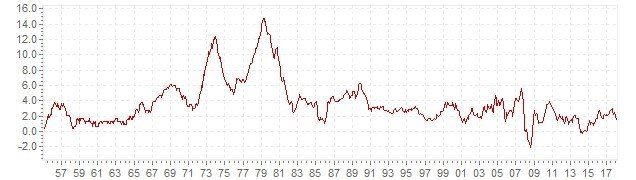
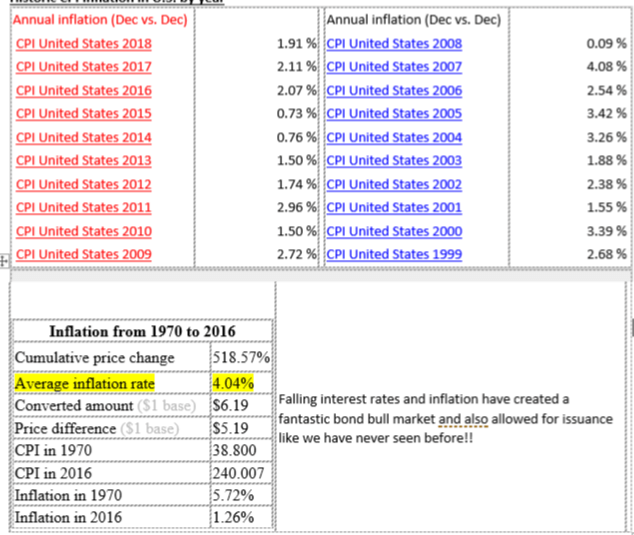
1.      Falling inflation

2.      Falling interest rates

3.      Increased globalization

4.      Deregulation

5.      Shareholder-first capitalism

6.      Baby boomers coming to peak earnings

7.      Passive investing (indexing)

8.      Extreme interventionist monetary policy, primarily Quantitative Easing (QE) and Zero Interest Rate Policy (ZIRP)

Resulting in: Financial Asset Overvaluations (bubbles)
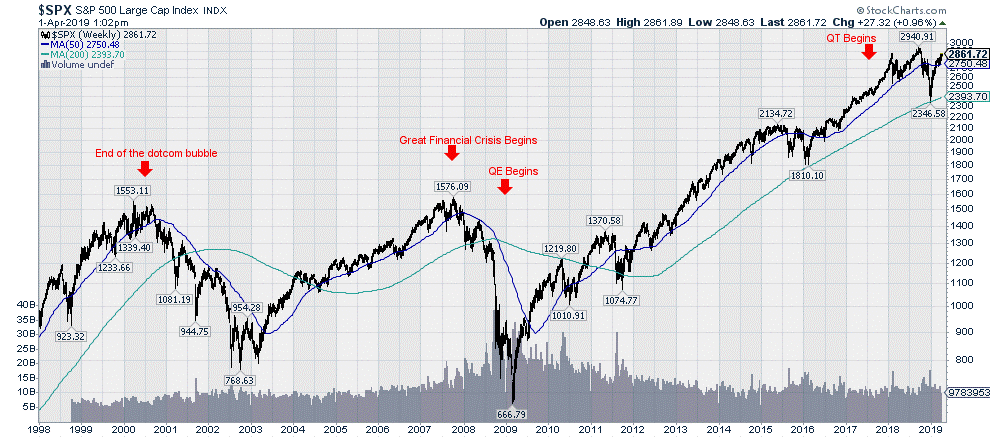


The massive stimulus that began in 2008, which was required to combat the Great Financial Crisis, created the greatest bull market in stocks…ever.
S&P 500 Index 1998 to Current

It appears form the chart below that a “normal” correction of the great stock market advance that began in 2009 would bring the S&P 500 Index down by about 38% to 50%.


Most of the massive measures that were implemented to diminish the damage of, and aid recovery from, the 2008-2009 crisis were referred to as Quantitative Easing (QE) and Zero Interest Rate Policy (ZIRP). As part of this effort, the U.S. Federal Reserve’s (Fed) balance sheet assets grew from less than $1 billion to well over $4 trillion as a result of QE in its various forms. The resulting challenge currently is how and when to reverse the stimulus and manipulation without significant unintended consequences.  

QE is an extraordinary expansion of the open market operations of a central bank to create the “wealth effect”. It’s used to stimulate the economy by making it easier for businesses to borrow money. The bank buys securities from its member banks to add liquidity to capital markets. This has the same effect as increasing the money supply. In return, the central bank issues credit to the banks reserves to buy the securities.


Where do central banks get the credit to purchase these assets? They simply create it out of thin air. (Only central banks have this unique power.) This is what people are referring to when they talk about the Fed “printing money.”


 The purpose of this type of expansionary monetary policy is to lower interest rates and spur economic growth. Lower interest rates allow banks to make more loans. Bank loans stimulate demand by giving businesses money to expand. They give shoppers credit to purchase more goods and services. By increasing the money supply, QE keeps the value of the country's currency low. This makes the country's stocks more attractive to foreign investors. It also makes exports cheaper.


This chart shows how the level of securities held by the Fed had a direct effect on stock valuations.

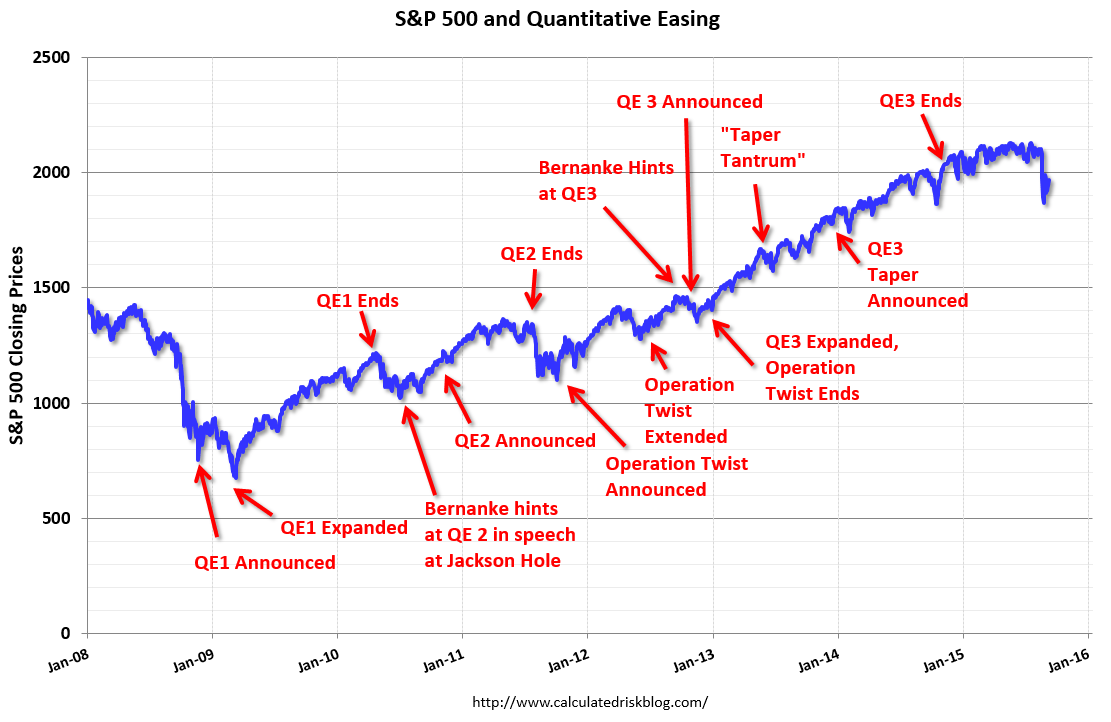
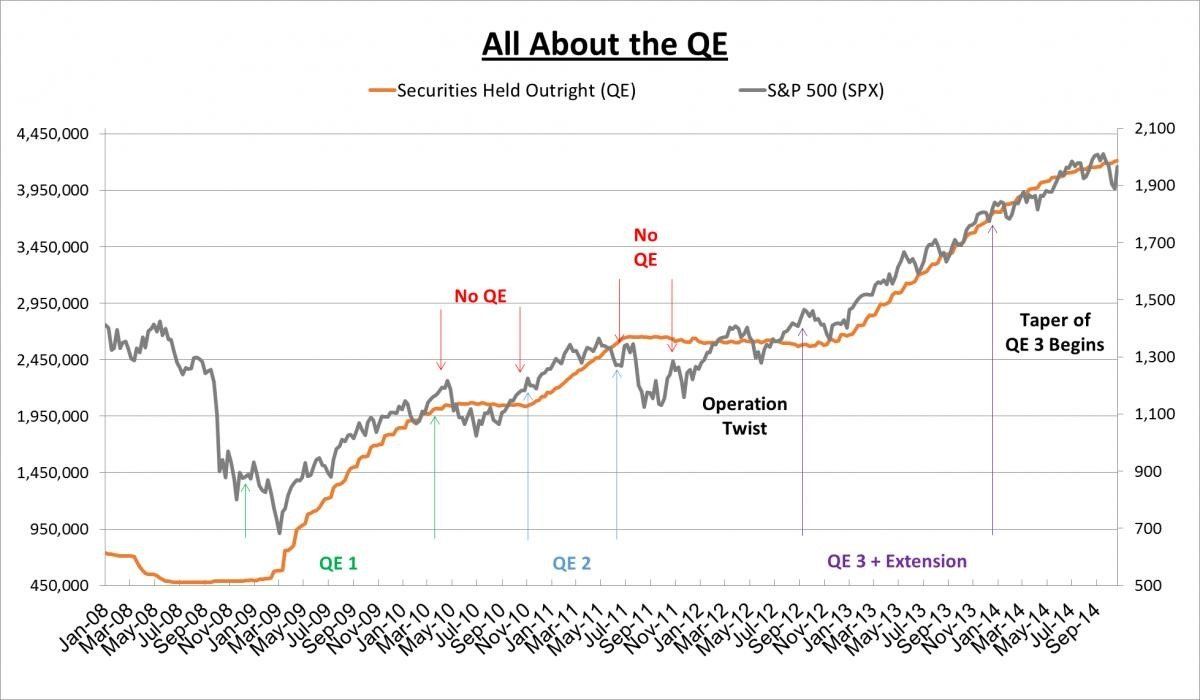
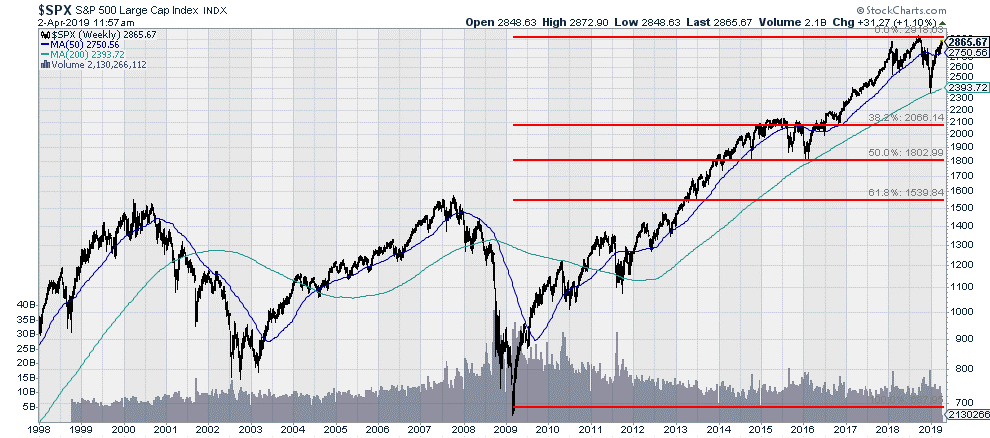
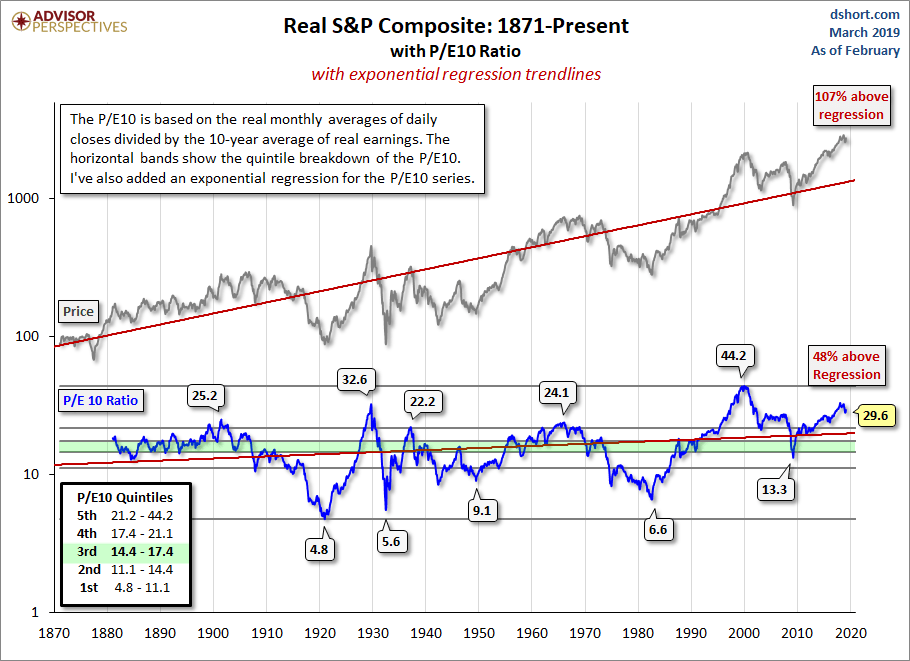
The stock market boom that began in 2009 would have been considered almost impossible based on prior history. And furthermore, for it to be accompanied by a real estate boom and a bond market boom that took the valuations of both to historical records at the same time is even less probable. It appears that this can only be explained by extremes in monetary policy that we have also never seen before. Those monetary measures must be unwound. So, the question becomes, how much of the stock, real estate and bond investment market boom will be unwound as unintended consequences? Common sense would imply that it would be very significant. And markets tend to overshoot on both ends of the scale.  


The stimulus failed to produce a stronger economy or Gross Domestic Product (GDP). GDP was much higher during prior recovery periods. The International Monetary Fund has recently been reducing its forecast for world growth in 2019. In October their estimate was 3.7%, in January it was 3.5% and the most recent was 3.3%. This, of course, includes China, the second largest economy, with a much higher growth rate. It appears the global economy is reliant on bubbles. Bubbles always burst.


Long Term GDP
The current economic recovery that began in 2009 is only a few weeks away from becoming the record longest recovery in U.S. history. But it is also the weakest recovery in history. Even with record stimulus measures, GDP growth has averaged only 2.3% since growth began in 2009. As can be seen from the chart above, GDP has grown at a much higher rate in prior recoveries.
Historic CPI Inflation in U.S. – yearly basis – full term
Historic CPI Inflation in U.S. by year

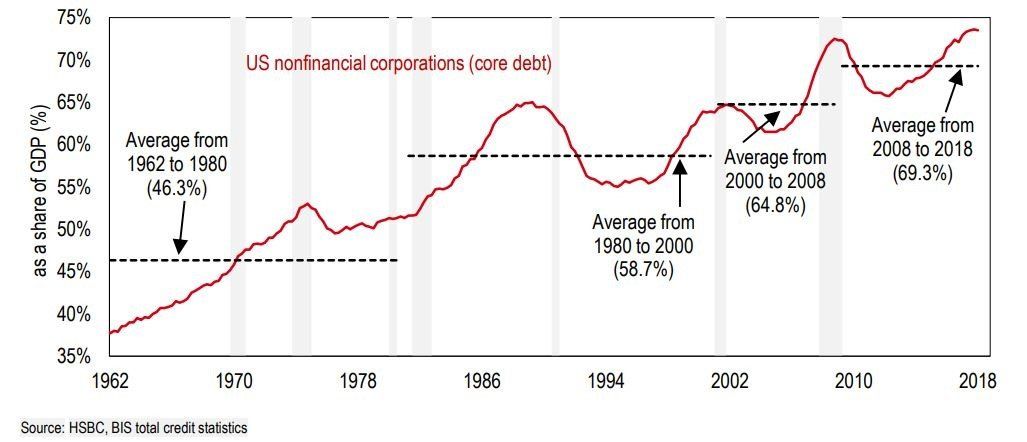
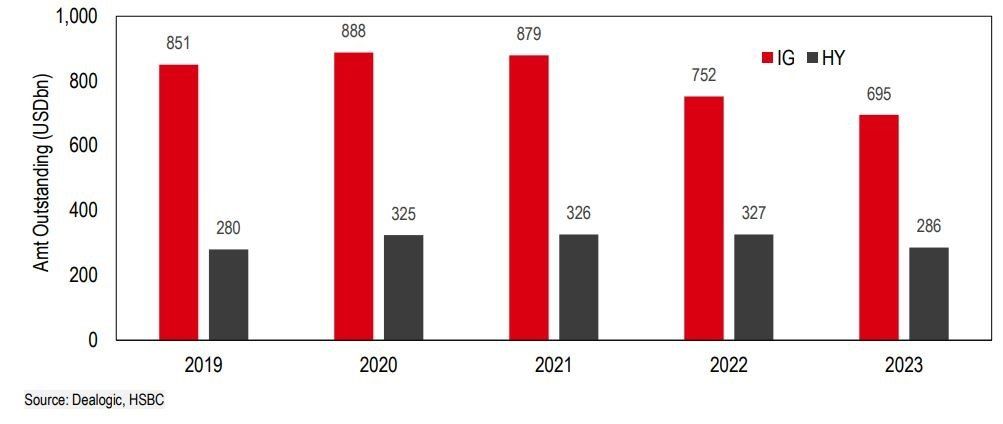
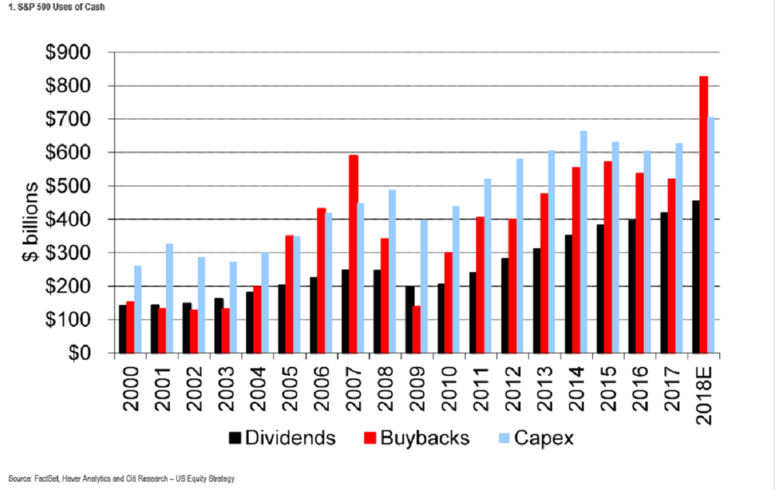
A mountain of corporate debt has resulted from the low interest rate policy. Companies have taken advantage of record-low interest rates to force up their balance sheets like they have never done before. Much of the capital raised this way has gone to fund stock buybacks, pushing equity valuations ever higher while leaving companies with dwindling assets to support their record liabilities.


Corporate Debt as a Percentage of GDP
The average quality rating of corporate bonds has fallen substantially. Lower-rated BBB bonds have risen by about 37% of the average since 2008. As a result of QE and ZIRP, bond index funds now carry substantially more risk. BBB is the lowest allowable rating for a bond to qualify for inclusion in an “Investment Grade” bond fund.
The lowest interest rates ever have pushed traditional savers into much riskier securities in order to increase their yield. The market size for high-yield bonds (also referred to as “junk bonds”) as well as the “leveraged loan” market have increased substantially. A leveraged loan is a type of loan that is extended to companies or individuals that already have considerable amounts of debt and/or a poor credit history. Leveraged loans carry a higher risk of default, and as a result a leveraged loan is more costly to the borrower. Junk bonds and leveraged loan funds have become very popular because of their relatively high interest rates based on their high-risk level. The Fed recently warned that a downturn could expose vulnerabilities in U.S. corporate debt markets, “including the rapid growth of less-regulated private credit and a weakening of underwriting standards for leveraged loans”.
Also noteworthy is the relatively large volume of bonds that are scheduled to mature during the next five years. Of course, the related interest rates will then be reset based on the current rates and qualifications at the time. The loans may not be extended at all.
5-Year Maturities of Investment Grade and High Yield Debt
Lenders tightened their standards following the 2008-2009 crisis, but subsequently returned to the easy lending standards that were attributable to the crisis… as if nothing ever happened.
Debt issuance, amid declining credit standards, has enabled a massive debt-for-equity swap which is precisely what the trillions of dollars of stock buy-backs over the past decade represent. Historically, companies have bought back their own company stocks at higher than average valuation. That certainly appears to be the case this time around. Stock buy-backs create a deception of higher valuations, thereby inflating the bubble. But when a downturn occurs…the cash is gone. When rates rise, interest payments are unmanageable.
Uses of funds borrowed based on ZIRP and easy qualification standards
QT began in late 2017. Stocks became more volatile. Since Pres. Trump previously claimed credit for the great stock market advance, he did not want a volatile market. So, he called Fed Chairman Powell his enemy and threatened to fire the Chairman. Stocks tumbled in late 2018. Chairman Powell caved to political pressure and stopped the QT process. Stocks soared. Once again, the process of going back to normal has been postponed…but not eliminated. Central banks have postponed their plans to increase interest rates further. Wall street loves it. What we have is an attempt to interfere with normal cycles, make things smooth and stall the next crisis by keeping interest rates low.
S&P 500 Index – 3 Year Chart
The powerful advance in the stock market the first of this year was unique. There has never been such a strong rally in such a short period of time other than during a bear market scenario. A lot of unique things have resulted from the huge amount of stimulus which has continued for such a long time. Note that the recent extraordinary rise and fall of the stock market has been due to the Fed policy changes…not a real change in value in either direction.

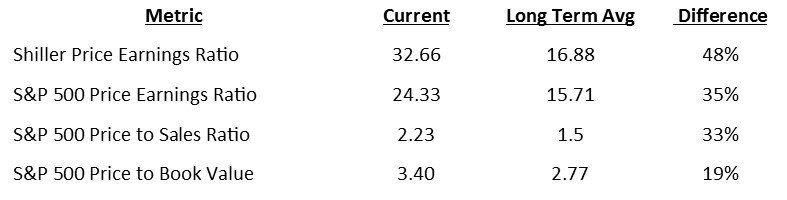
"Price is what you pay; value is what you get." -Warren Buffett

 
Investors are obviously giving too little consideration to the value they are getting in exchange for the price they are paying for stocks. This is clearly indicated by the three following charts reflecting the historical and current price paid compared to valuation metrics, especially the price related to earnings (P/E) ratio. As of March, the Crestmont P/E ratio, at 31.4, was 119% above its average.

Stock Valuation Based on the Most Common Quoted Metric – the P/E Ratio

There are several factors that make the recent above average buying of risky assets unique. Most notable may be the extent of extreme overvaluation not just within the stock market but across a number of other asset classes. The incredible reach for yield, driven by the lowest interest rates ever, has played out in everything from junk bonds and dividend-paying stocks to real estate and master limited partnerships.


Stock Valuation Based on the P/E10 Ratio

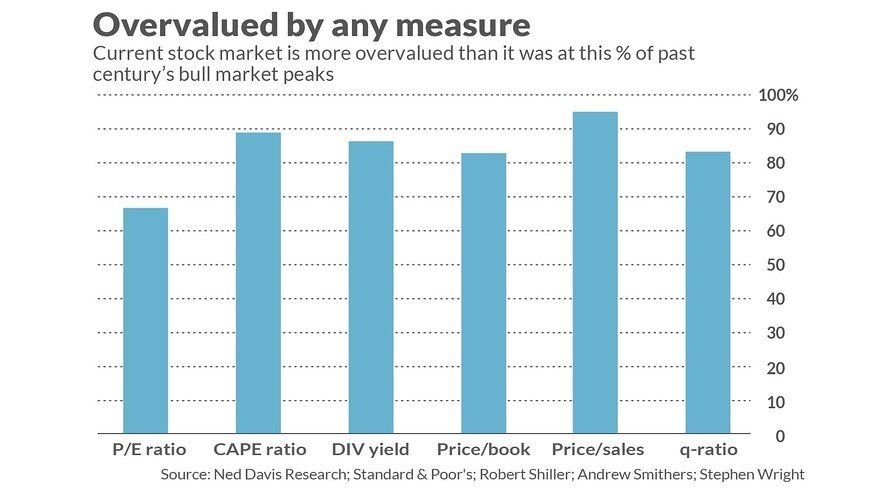
·     The price/book ratio, which stands at 3.0 to 1. This ratio is higher than that at 22 of the 29 major market tops since 1929.


·     The price/sales ratio, which stands at an estimated 1.9 to 1. At 18 of the 19 market tops since the mid-1950s, the price/sales ratio was lower.


·     The dividend yield, which currently is 2.3% for the S&P 500. At 31 of the 36 bull-market peaks since 1900, the dividend yield was higher.


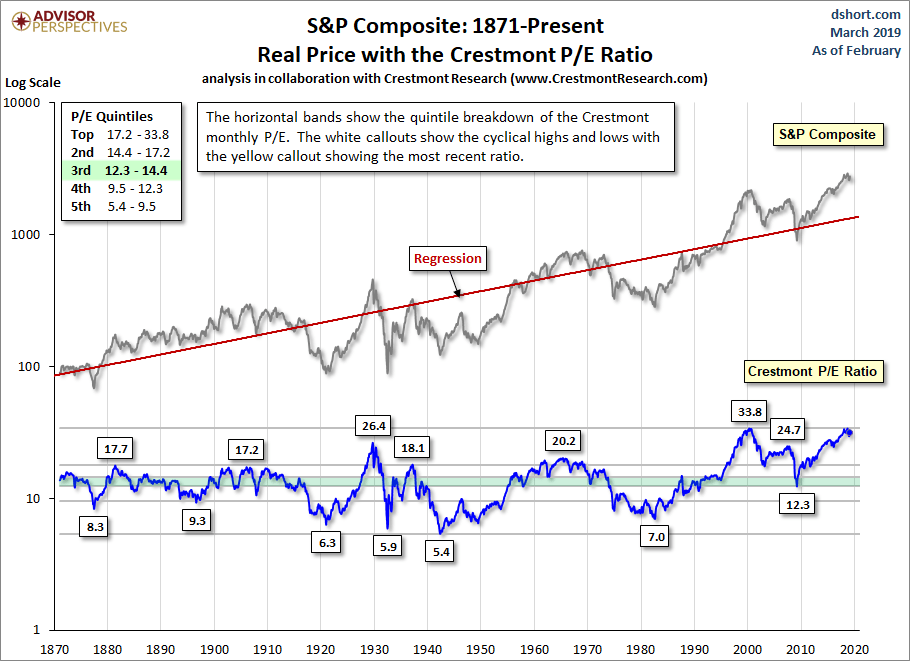
·     The cyclically adjusted price/earnings ratio, which currently stands at 29.0. This is the ratio championed by Yale University’s Robert Shiller. It was lower than where it is today at 32 of the 36 bull-market highs since 1900.


·     The so-called “Q” ratio, which is calculated by dividing market value by the replacement cost of assets. According Stephen Wright, an economics professor at the University of London, and Andrew Smithers, founder of the U.K.-based economics-consulting firm Smithers & Co., the Q-ratio currently is higher than it was at 30 of the 36 bull-market tops since 1900.


·     P/E ratio. This is the valuation indicator that is currently painting the least-bearish (most bullish) picture. Perhaps not coincidentally, it is the indicator that is most often quoted in the financial press. Nevertheless, according to data on as-reported earnings compiled by Yale’s Shiller, and based on S&P estimates for the fourth quarter, this ratio currently stands at 18.4 to 1. That’s still higher than 67% of past bull-market peaks.


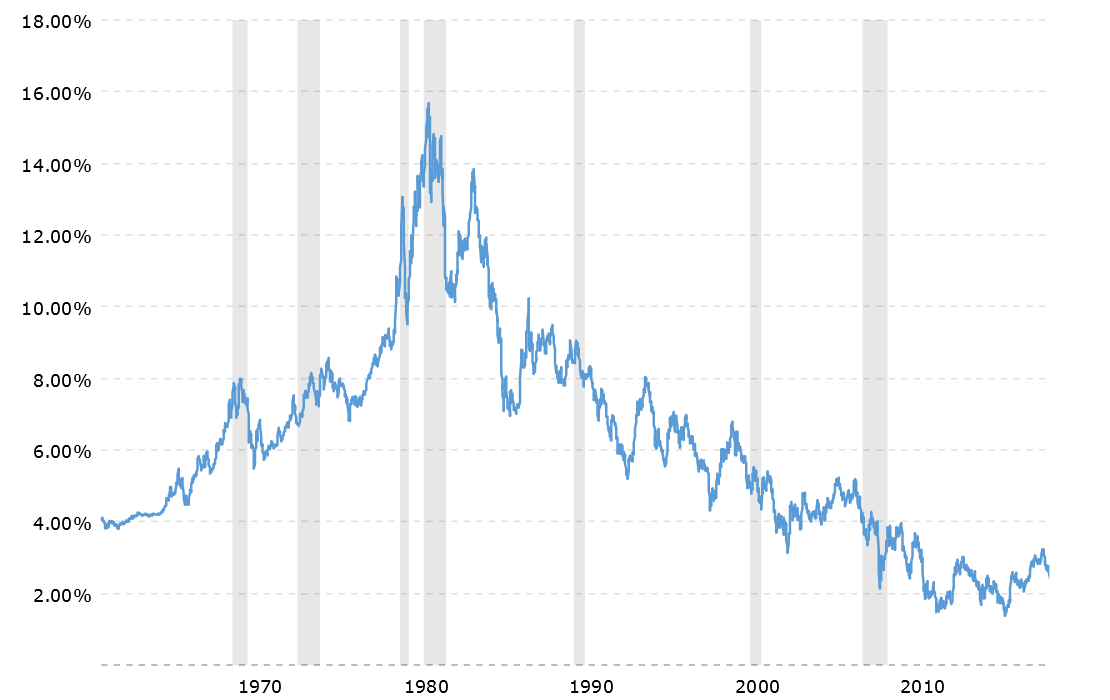
Bond values move in the opposite direction of yields. Therefore, the bond market valuation chart would be the reverse of the following chart of the 10-year bond yields. The stimulus has not only created a bubble in stocks, it has also created bubbles in bonds and other financial assets.
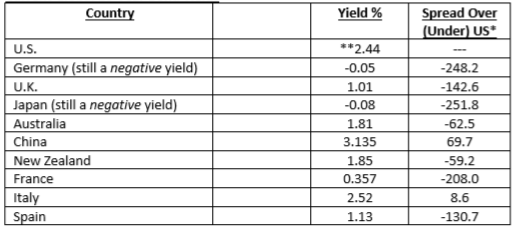

Historical U.S. 10-Year Bond Yields – gray areas represent recessions
The lowest interest rates in human history—the end of the great debt super cycle—therefore, the outlook for descent returns on bonds is not good. Bonds move in cycles of about 30 years.
Current Global 10-Year Bond Yields

*in basis points

**the long-term average is approximately 5%, depending on the term


Summary

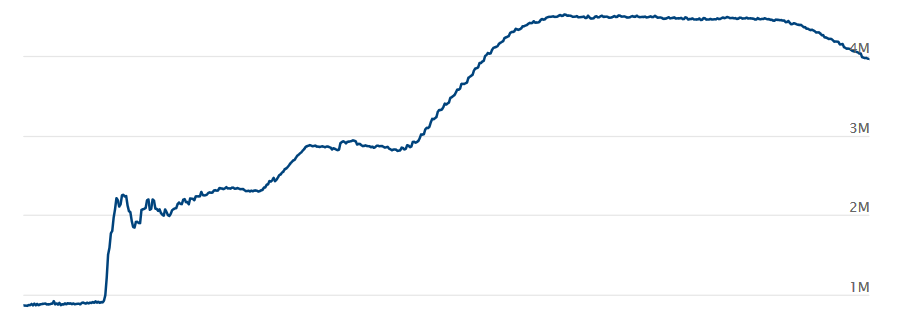
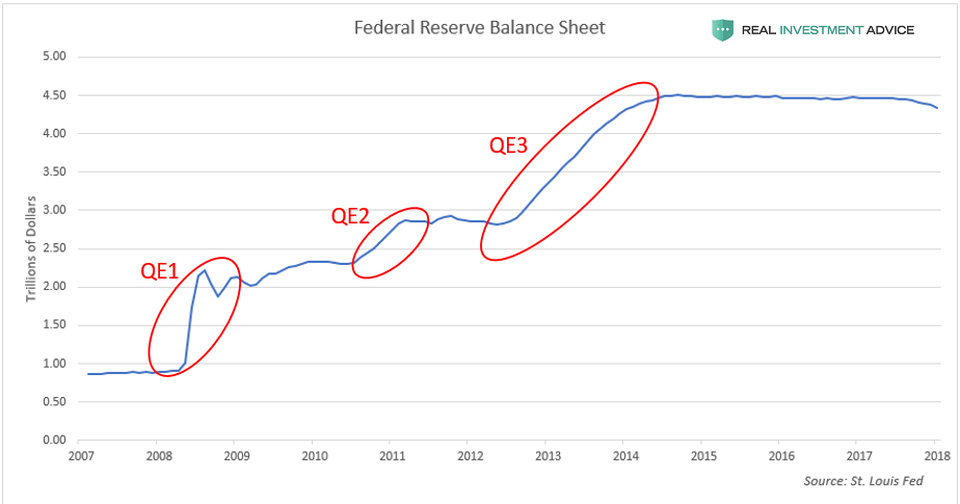
This report is primarily based on research, analysis and charts that I purchase from investment professionals for whom I have a high regard. The reason I put this report together is to attempt to shed some light on the level of risk to which investors are exposed in the current investment environment. After ten years of extreme manipulation and stimulus, my observation as an advisor is that, for the most part, investors are not giving careful attention to the risk in relation to potential reward. In my opinion, extreme caution is advised. If I understand correctly, over $4 trillion of conjured-up money on the balance sheet of the U.S. Federal Reserve must be substantially eliminated. How and when this will be done and what unintended consequences will result are still unknowns—it has never been done before. And, if I understand correctly, after ten years of zero interest rate policy, target interest rates must be “normalized” globally. According to data from Deutsche Bank Securities, about $10 trillion of government bonds worldwide are priced to yield less than zero, which guarantee that a buyer will receive less in repayment and interest than the buyer paid for the bonds. This is not “normal”. I’m convinced that investment markets are due for a significant revaluation to the downside. No one knows when this will happen or how long the global central banks and governments can postpone it. No one knows what the catalyst will be that initiates the process, but it will surely be something totally unexpected. Index funds have performed well since 2009 and, as a result have grown tremendously in size. It seems reasonable that they are more heavily exposed to a significant downturn.


My goal is to be readily prepared and attempt to earn a decent return while significantly limiting exposure to the probable downturn. When crisis occur, opportunities arise for those who are prepared. Being cautious and flexible is advisable for anyone who is invested in risky assets—especially those who are retired or near retirement age. Financial advisors are fond of say things like, “we are long term investors, the market will come back after a downturn—it always does”. But sometimes it takes 20 years or more for a “comeback” to happen, and it is worse when inflation is included in the computation.


Thank you for reading. Any comments or criticisms would be appreciated.


Best regards in your efforts to maintain a comfortable standard of living, especially during retirement.


At your service to the praise of His glory,


Gary Clark


By Gary Clark 21 Aug, 2018
With stocks, what you pay is what you get. In the process of making investment decisions, stock market valuations are very important, especially in the long run. The main driver of future stock returns is valuation. A study by Vanguard for the period 1926 through 2011 showed that valuation and especially a long-term measure of valuation were the only factors that predicted anything. The most quoted metric for stock valuations is the price to earning (PE) ratio. Of course, valuations are more meaningful when considered on a comparative basis. Following are some current basic valuation metrics compared to long-term historical averages:

By Gary Clark 21 Aug, 2018

The rich rules over the poor, and the borrower becomes the lender’s slave. Proverbs 22:7

Saving is deferred gratification--resisting an immediate reward in preference for a later reward. Debt, of course, is the opposite. My observation and concern are that the trend has moved so significantly in favor of immediate reward that it is (or will be) greatly affecting the standard of living in retirement for a lot of folks.

Materialism: a way of thinking that gives too much importance to material possessions rather than to spiritual or intellectual things. Merriam-Webster

A study titled, “Graying of U.S. Bankruptcy: Fallout from Life in a Risk Society,” found that between 2013 and 2016, the average rate at which 65- to 74-year-old Americans filed for bankruptcy increased to 3.6 out of every 1,000 individuals from a rate of 1.2 per 1,000 in 1991. The percentage of older folks in bankruptcy has never been higher. The rate at which Americans age 65 and older are filing for bankruptcy has more than tripled since 1991. Becoming dependent on governments, family and friends during retirement is a very serious matter.

Part of the problem is the relative reduction of safety-net programs, including Social Security and Medicare. Another factor is the shift from defined benefit pension plans, which guarantee a set income for life, to defined contribution plans (401-K type plans) which leave it up to the participants to determine how much to invest and, therefore, how much they will receive in retirement. But the more basic and significant problem is a lack of discipline to make the right choice between deferred gratification and immediate reward.

Whoever loves money never has enough; whoever loves wealth is never satisfied with their income. Ecclesiastes 5:10

The Federal Reserve Bank of NY’s second quarter report on household debt and credit indicates that consumer debts rose by $82 billion. Consumer debt has continued to mount up over the past four years and grown to well over $13 trillion in the second quarter. Household debt is almost 20% higher than it was five years ago and higher than it was before the financial crisis. It appears that memories are short, and we have gone full circle.

As you know, the Fed along with the folks in Washington have been busy for several years encouraging you and me to borrow, spend and invest in risky assets, especially since 2008. This makes the economy grow, creating more jobs and higher wages so that we can…spend more. And, if too many borrowers have insufficient credit, they can just change the rules. For example, a significant problem with getting a loan is having a debt in collections. This, of course, appears on credit reports. So, a series of changes have occurred in the past few years to remove such negative information from credit reports. According to Equifax, collections were completely removed from eight million consumers’ credit reports in the 12 months through June. This resulted in an average 14-point increase in credit ratings. That’s the way we do it!  

As you know, the Fed finally and began the process of raising rates in December 2015, just a smidgen at the time. But rising rates have done little to discourage borrowers. For example, In the second quarter, lenders originated $151 billion of auto loans, the most in 13 years. Mortgages rose to $9 trillion, the highest level since 2009.  

I denied myself nothing my eyes desired;
    I refused my heart no pleasure.
My heart took delight in all my labor,
    and this was the reward for all my toil.
Yet when I surveyed all that my hands had done
    and what I had toiled to achieve,
everything was meaningless, a chasing after the wind;
    nothing was gained under the sun. Ecclesiastes 2:10-11

QE times 3, TARP, ZIRP and other manipulative measures used to stimulate the economy have been effective. But wait, there’s more: we are in debt and don’t know how we will maintain our higher standard of living in retirement. Someone needs to do something.

Consequence: a result of a particular action or situation, often one that is bad or not convenient. Cambridge English Dictionary

I encourage everyone upon whom I have any influence to carefully consider your financial situation, especially as it relates to maintaining a comfortable standard of living during retirement. It will not take care of itself.

When I can help, please let me know.

At your service,

Gary Clark


Show More
Share by: