July 2018
- By Gary Clark
- •
- 21 Aug, 2018
- •
With stocks, what you pay is what you get. In the process of making
investment decisions, stock market valuations are very important,
especially in the long run. The main driver of future stock returns is
valuation. A study by Vanguard for the period 1926 through 2011 showed
that valuation and especially a long-term measure of valuation were the
only factors that predicted anything. The most quoted metric for stock
valuations is the price to earning (PE) ratio. Of course, valuations are
more meaningful when considered on a comparative basis. Following are
some current basic valuation metrics compared to long-term historical
averages:
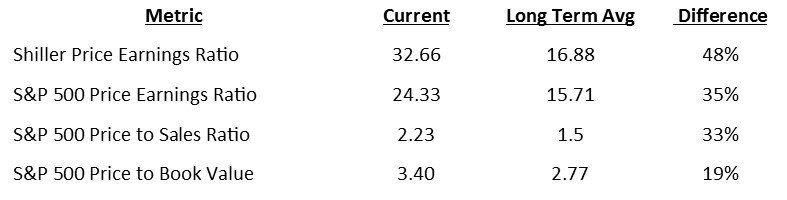
Many professional investment managers consider the most valuable metric
to be the Shiller PE Ratio, which is based on average inflation-adjusted
earnings for the previous 10 years. It is also known as the Cyclically
Adjusted PE Ratio, CAPE Ratio and PE 10. Dr. Robert Shiller is a highly
regarded Professor of Finance at Yale. As you can see from the chart,
the CAPE suggests that stocks are currently overvalued by about 48%.
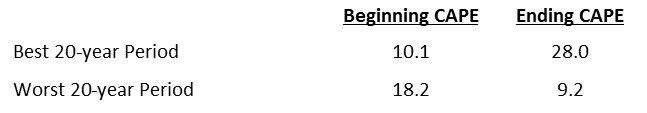
A study by Crestmont Research illustrates the importance of valuation by considering stock market total returns between 1919 and 2017 and slicing them into deciles from the worst to the best over 20-year periods. At over 32, the CAPE currently sits firmly at the most expensive decile historically.
A study by Crestmont Research illustrates the importance of valuation by considering stock market total returns between 1919 and 2017 and slicing them into deciles from the worst to the best over 20-year periods. At over 32, the CAPE currently sits firmly at the most expensive decile historically.
Currently high and rising PE ratios are an indication that investors are
willing to pay more for stocks than current valuations indicate, based
on hope that earnings and valuations will eventually catch up in the
future. (Hope is good, but it is not an investment process.) When PE
ratios are reaching historical highs and savings rates are reaching new
lows, we have the hallmarks of a bull market. During 2017 we had both.
But it’s a time for caution because PE ratios cannot rise forever, and
savings rates cannot forever decrease.
It appears that major media outlets are biased and playing down some important developments and growing trends rather than highlighting them. I am concerned about what I believe are some major threats to investment markets right now. I feel that it is my job to make my clients aware of them. One area of concern is the apparent over valuation, especially in big tech. The flows into technology stocks of late have been especially surprising. The so-called FAANG stocks (Facebook, Apple, Amazon, Netflix and Google) have been the market favorites for quite some time, so it’s understandable that investors would chase their performance just as they do during every bull market. As of July 10, just three stocks account for over 70% of the year to date returns on the S&P 500 and the NASDAQ 100. The S&P 500 returned 1.8% in the first half of 2018, but without the FAANG stocks, the return would be -0.73%. Such an impact from a handful of stocks usually doesn’t end well.
As you are probably aware, stocks are capitalization weighted in the S&P 500 Index. Accordingly, since Apple is the largest company, it has the largest position in the S&P 500, at about 3.7% of the total index. According to ETFdb.com, there are 92 ETFs that not only own Apple, they have an overweight allocation relative to the S&P 500. So not only are Apple fans and traditional passive investors buying lots of Apple, these other ETF investors are even more aggressively acquiring the stock. Also, Google, Amazon and Facebook are over weighted in over 100 ETFs. So, when the trend reverses and ETF investors begin to sell, these will be the stocks with the highest dollar amount of sales.
More to the point…. Unless I am missing something hidden in plain sight, according to any valuable measurement, stocks are extremely overvalued. For example, Grantham Mayo & van Otterloo is a highly respected investment management firm with about $120 billion in assets under management. They provide a 7-year asset class real return forecast which is updated monthly. As of June 30, their 7-year real return projection for U.S. large cap stocks is a negative 4.4%. Of the eleven asset classes that they include in the forecast, only three have positive return projections; emerging market stocks at 2.7%, emerging market bonds at 2.3% and U.S. cash at 0.8%.
A financial bubble occurs when prices are dislocating from historical fundamentals, along with reasonable expectations of future ones. One such fundamental is earnings based on generally accepted accounting principles. Earnings are cyclical. That is one reason that value investors focus more on the earnings power and profitability of a company over time. But since the 2008 crisis, earnings and related valuations have been manipulated, primarily by global central banks, and cycles have been interrupted…temporarily. The Nasdaq Composite Index has exceeded its late 1990s dot-com era highs in market cap relative to the S&P 500. But according to strategists at Goldman Sachs, “Unlike the technology mania of the 1990s, most of this success can be explained by strong fundamentals, revenues and earnings rather than speculation about the future”. Alrighty then….
When market prices dislocate from past earnings records as indicted by record-high territory for the CAPE ratio, its time to pay attention no matter what the level of interest rates—but especially when rates are rising. As the global manipulation process including QE and ZIRP are unwound, reasonable financial asset prices will again be discovered, and mean reversion will occur.
No one knows how big the resulting changes will be, but I see more and more indications that they may be quite significant. Just as an example, an article in today’s Wall Street Journal reads, “Bond Yields Surge World-Wide”. It’s my job to find out what happened and how it may affect my clients’ accounts. It was reported that the Bank of Japan (the central bank) “might consider changing its interest rate targets”. That “might consider” comment pushed the yield on the Japanese 10-year government bond up to 0.09% on Monday from 0.03% on Friday. The fraction of percent sounds miniscule but that is a 300% change based on the “might consider”. And, according to Bloomberg, the central bank offered to buy all the bonds that sellers might wish to unload at a yield of 0.11%. But there were no takers. Nikkei recently reported that through ETF purchases under QE, the Bank of Japan has become a top-ten shareholder in nearly 40% of listed companies in Japan. Also, last week Facebook reported disappointing earnings. The shares fell by 19%, wiping out $120 billion in value. This was one of the largest one-day collapses for a company’s stock price ever.
Market capitalization in relation to GDP became a popular long-term valuation indicator after Warren Buffet remarked that, “it is probably the best single measure of where valuations stand at any given moment”. The current reading is 132.7%. Of course, that reading becomes meaningful only when compared to other readings. The lowest reading was 32.2% at the bottom of the 1970s and 1980s bear market. From there it rose to 151.3% at the top of tech boom in the 1990s. So, the current reading is second highest--and only about 12% below the highest--reading since the ratio began in the early 1950s. Using a shorter time frame beginning in 1971, the ratio is at the highest point.
The current reading of S&P 500 real sales is only about 15% above the year 2001 level. Top line real sales growth is important, of course, but more important is the bottom line. S&P 500 real earnings growth at 11.5% is about 52% less than the average since 1990. Current S&P 500 earnings yield (the inverse of the PE) is 44% less than the average since 1970. It’s no secret that Wall Street analysts tend to low-ball earnings estimates. Doing so makes it easy for companies to beat expectations and helps boost stock prices over the long run. According to FactSet Research, 78% of companies beat analyst earnings expectations in the first quarter. But it appears that investors have become less impressed with earnings beats. Last quarter was the fourth straight quarter that stocks of companies that beat forecasts gained less than 1% on average, per FactSet. Now that we are amid second quarter earnings season, this is worth keeping an eye on.
Some other trends that concern me:
In summary, in 2008 we faced a very significant financial crisis. Crisis measures were required to prevent what probably would have become the worst financial crisis in U.S. history within a matter of days. Crisis measures were implemented and were successful in averting a further catastrophe. The crisis measures were extended and compounded long after the risk abated to generate a recovery from the recession. A major objective of the measures implemented was to manipulate financial markets, pushing financial asset valuations up, to create a “wealth effect” and make people spend more. Target interest rates were reduced to zero in the U.S. and even to negative levels in other countries. Money was made readily available at the lowest rate in history for companies, governments and individuals to borrow and spend. Investors were pushed into riskier assets in pursuit of income, causing risky asset valuations to escalate further. The S&P 500 Index rose from an intraday low of 666 in March 2009 to over 2800 today. Obviously, much of the increase has been due to the manipulation. The process of reversing the manipulation in the U.S. was implemented last fall.
As mentioned above, hope is not an investment process. Hope is the state of mind that believes and desires a positive outcome to situations in your life. It is the feeling that things will turn out for the best. It is consistently looking forward to that positive outcome to something planned in our life. Hope is going through life expecting with confidence that everything is going to be OK. Hope is cultivated when we have a goal in mind and are determined to achieve that goal because of the plans we have in place. It’s not a fantasy but something that has been thought out and planned. Along with faith and love, hope is an enduring virtue of the Christian life (1 Corinthians 13:13), and love springs from hope (Colossians 1:4-5). Hope produces joy and peace in believers through the power of the Spirit (Romans 12:12; 15:13). Paul attributes his apostolic calling to the hope of eternal glory (Titus 1:1-2). Hope in the return of Christ is the basis for believers to purify themselves in this life (Titus 2:11-14, 1 John 3:3).
It appears that major media outlets are biased and playing down some important developments and growing trends rather than highlighting them. I am concerned about what I believe are some major threats to investment markets right now. I feel that it is my job to make my clients aware of them. One area of concern is the apparent over valuation, especially in big tech. The flows into technology stocks of late have been especially surprising. The so-called FAANG stocks (Facebook, Apple, Amazon, Netflix and Google) have been the market favorites for quite some time, so it’s understandable that investors would chase their performance just as they do during every bull market. As of July 10, just three stocks account for over 70% of the year to date returns on the S&P 500 and the NASDAQ 100. The S&P 500 returned 1.8% in the first half of 2018, but without the FAANG stocks, the return would be -0.73%. Such an impact from a handful of stocks usually doesn’t end well.
As you are probably aware, stocks are capitalization weighted in the S&P 500 Index. Accordingly, since Apple is the largest company, it has the largest position in the S&P 500, at about 3.7% of the total index. According to ETFdb.com, there are 92 ETFs that not only own Apple, they have an overweight allocation relative to the S&P 500. So not only are Apple fans and traditional passive investors buying lots of Apple, these other ETF investors are even more aggressively acquiring the stock. Also, Google, Amazon and Facebook are over weighted in over 100 ETFs. So, when the trend reverses and ETF investors begin to sell, these will be the stocks with the highest dollar amount of sales.
More to the point…. Unless I am missing something hidden in plain sight, according to any valuable measurement, stocks are extremely overvalued. For example, Grantham Mayo & van Otterloo is a highly respected investment management firm with about $120 billion in assets under management. They provide a 7-year asset class real return forecast which is updated monthly. As of June 30, their 7-year real return projection for U.S. large cap stocks is a negative 4.4%. Of the eleven asset classes that they include in the forecast, only three have positive return projections; emerging market stocks at 2.7%, emerging market bonds at 2.3% and U.S. cash at 0.8%.
A financial bubble occurs when prices are dislocating from historical fundamentals, along with reasonable expectations of future ones. One such fundamental is earnings based on generally accepted accounting principles. Earnings are cyclical. That is one reason that value investors focus more on the earnings power and profitability of a company over time. But since the 2008 crisis, earnings and related valuations have been manipulated, primarily by global central banks, and cycles have been interrupted…temporarily. The Nasdaq Composite Index has exceeded its late 1990s dot-com era highs in market cap relative to the S&P 500. But according to strategists at Goldman Sachs, “Unlike the technology mania of the 1990s, most of this success can be explained by strong fundamentals, revenues and earnings rather than speculation about the future”. Alrighty then….
When market prices dislocate from past earnings records as indicted by record-high territory for the CAPE ratio, its time to pay attention no matter what the level of interest rates—but especially when rates are rising. As the global manipulation process including QE and ZIRP are unwound, reasonable financial asset prices will again be discovered, and mean reversion will occur.
No one knows how big the resulting changes will be, but I see more and more indications that they may be quite significant. Just as an example, an article in today’s Wall Street Journal reads, “Bond Yields Surge World-Wide”. It’s my job to find out what happened and how it may affect my clients’ accounts. It was reported that the Bank of Japan (the central bank) “might consider changing its interest rate targets”. That “might consider” comment pushed the yield on the Japanese 10-year government bond up to 0.09% on Monday from 0.03% on Friday. The fraction of percent sounds miniscule but that is a 300% change based on the “might consider”. And, according to Bloomberg, the central bank offered to buy all the bonds that sellers might wish to unload at a yield of 0.11%. But there were no takers. Nikkei recently reported that through ETF purchases under QE, the Bank of Japan has become a top-ten shareholder in nearly 40% of listed companies in Japan. Also, last week Facebook reported disappointing earnings. The shares fell by 19%, wiping out $120 billion in value. This was one of the largest one-day collapses for a company’s stock price ever.
Market capitalization in relation to GDP became a popular long-term valuation indicator after Warren Buffet remarked that, “it is probably the best single measure of where valuations stand at any given moment”. The current reading is 132.7%. Of course, that reading becomes meaningful only when compared to other readings. The lowest reading was 32.2% at the bottom of the 1970s and 1980s bear market. From there it rose to 151.3% at the top of tech boom in the 1990s. So, the current reading is second highest--and only about 12% below the highest--reading since the ratio began in the early 1950s. Using a shorter time frame beginning in 1971, the ratio is at the highest point.
The current reading of S&P 500 real sales is only about 15% above the year 2001 level. Top line real sales growth is important, of course, but more important is the bottom line. S&P 500 real earnings growth at 11.5% is about 52% less than the average since 1990. Current S&P 500 earnings yield (the inverse of the PE) is 44% less than the average since 1970. It’s no secret that Wall Street analysts tend to low-ball earnings estimates. Doing so makes it easy for companies to beat expectations and helps boost stock prices over the long run. According to FactSet Research, 78% of companies beat analyst earnings expectations in the first quarter. But it appears that investors have become less impressed with earnings beats. Last quarter was the fourth straight quarter that stocks of companies that beat forecasts gained less than 1% on average, per FactSet. Now that we are amid second quarter earnings season, this is worth keeping an eye on.
Some other trends that concern me:
- Margin debt reached an all time high a few years ago and has continued to rise, both in nominal terms and relative to GDP. Margin debt currently amounts to about $650 billion. Add to that the additional leverage that can be employed today using futures and leveraged ETFs. This simply represents the amount of forced liquidations facing the market once it enters a downturn.
- Consumer debt has been soaring during the current cycle.
- Macro trends set in motion decades ago—like our rapidly aging population along with record levels of debt—are starting to take their toll on economic growth.
- Political and economic tensions are mounting both in the US and globally.
- US mid-term elections in November may pose a risk.
- The Fed is in the process of raising rates further, which takes away the main driver of equity prices since 2008.
- Wages (in real terms) and consumer spending are not growing, putting a strain on business growth.
- The U.S. economic expansion has now become the second longest since 1930.
- The bull market in stocks is already the second strongest in the last 100 years.
- As of July 1, the Fed’s monthly limit on its QE unwinding program, designed to shrink its current $4.1 trillion balance sheet, rose to $40 billion from $30 billion in the previous fiscal quarter. The monthly limit will reach its maximum $50 billion in October. Since the Fed began QT on Oct. 1, total assets are down by 3.68%, for a simple annualized pace of 4.55%.
- On June 14, the European Central Bank announced it will curtail its current $30 billion in monthly asset purchases (QE) as of December.
- The BBB bond rating is one step above “junk” status. The number of BBB-rated companies is up 50% since 2009. When mutual funds and ETFs which hold BBB debt start getting redemptions, institutional investors won’t wait around to see what happens next. Institutions have rules that will make them start selling troubled bonds early. A problem with liquidity will result, which will create more selling pressure.
In summary, in 2008 we faced a very significant financial crisis. Crisis measures were required to prevent what probably would have become the worst financial crisis in U.S. history within a matter of days. Crisis measures were implemented and were successful in averting a further catastrophe. The crisis measures were extended and compounded long after the risk abated to generate a recovery from the recession. A major objective of the measures implemented was to manipulate financial markets, pushing financial asset valuations up, to create a “wealth effect” and make people spend more. Target interest rates were reduced to zero in the U.S. and even to negative levels in other countries. Money was made readily available at the lowest rate in history for companies, governments and individuals to borrow and spend. Investors were pushed into riskier assets in pursuit of income, causing risky asset valuations to escalate further. The S&P 500 Index rose from an intraday low of 666 in March 2009 to over 2800 today. Obviously, much of the increase has been due to the manipulation. The process of reversing the manipulation in the U.S. was implemented last fall.
As mentioned above, hope is not an investment process. Hope is the state of mind that believes and desires a positive outcome to situations in your life. It is the feeling that things will turn out for the best. It is consistently looking forward to that positive outcome to something planned in our life. Hope is going through life expecting with confidence that everything is going to be OK. Hope is cultivated when we have a goal in mind and are determined to achieve that goal because of the plans we have in place. It’s not a fantasy but something that has been thought out and planned. Along with faith and love, hope is an enduring virtue of the Christian life (1 Corinthians 13:13), and love springs from hope (Colossians 1:4-5). Hope produces joy and peace in believers through the power of the Spirit (Romans 12:12; 15:13). Paul attributes his apostolic calling to the hope of eternal glory (Titus 1:1-2). Hope in the return of Christ is the basis for believers to purify themselves in this life (Titus 2:11-14, 1 John 3:3).
Thank you for reading. Thank you very much for
the opportunity to serve. Please let me know when you have questions or
when I can help.
Gary Clark

From the financial crisis of 2008-2009 until the present:
· Out
of the ordinary investment market conditions
· The
level of risk we face in maintaining our standard of living during retirement
|
|